
A metric is a “system or standard of measurement” represented in units that can be utilised to describe more than one attribute. Metrics come in very handy when it comes to quantify usability during the usability evaluation of software, websites and applications.
Why would you need to Measure Usability?
There are many reasons as to why someone would require to measure usability – the most common reason being the need to effectively communicate with the stakeholders of the system being evaluated. Other uses can be to satisfy the need for comparing the usability of two or more products and to quantify the severity of a usability problem.
Ultimately, the primary objective of usability metrics is to assist in producing a system or product that is neither under- nor over-engineered.
Usability Metrics – Where shall I start?
Usability is generally measured using a number of observable and quantifiable metrics that overcome the need to rely on simple intuition. Since there are several quantitative data sources that one can measure, it is very easy to become immersed in a distracting black hole of data that is interesting but lacking any actionable insight.
A Google search for ‘usability metrics’ yields no less than 9.3 million results. Just one quick look at the results of the first 2 pages of the SERP is sufficient to notice that there is a general disagreement with regards to what constitute the key usability metrics.
Naturally, the questions that come to mind are …“Which metric shall I use?”, “How shall I obtain the components needed to calculate it?”, “Is this metric reliable enough to give a realistic picture of the degree to which my system is usable (or not)?”.
In this article I will explain the ISO (International Organization for Standardization) recommendation of what constitute the key metrics for evaluating the usability of any system. I personally prefer this approach because it introduces the main usability metrics in a very structured manner rather than a haphazard collection of disjointed metrics.
The ISO/IEC 9126-4 approach to Usability Metrics
The ISO 9241-11 standard defines usability as “the extent to which a product can be used by specified users to achieve specified goals with effectiveness, efficiency and satisfaction in a specified context of use”. The reason why I marked effectiveness, efficiency and satisfaction in bold is because this definition clearly states that usability is not a single, one-dimensional property but rather a combination of factors.
The ISO/IEC 9126-4 Metrics recommends that usability metrics should include:
Effectiveness: The accuracy and completeness with which users achieve specified goals
Efficiency: The resources expended in relation to the accuracy and completeness with which users achieve goals.
Satisfaction: The comfort and acceptability of use.
However, the actual ways of how these should be measured is very often left at the discretion of the evaluator.
However, the actual ways of how these should be measured is very often left at the discretion of the evaluator.
Let us take a look at the key usability metrics that fall in each category.
1) Usability Metrics for Effectiveness
1.1 – Completion Rate
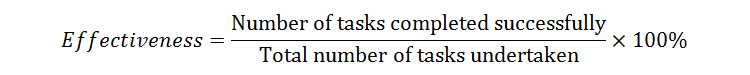
Effectiveness can be calculated by measuring the completion rate. Referred to as the fundamental usability metric, the completion rate is calculated by assigning a binary value of ‘1’ if the test participant manages to complete a task and ‘0’ if he/she does not.
Due to its simplicity, the completion rate is a metric that is very easy to understand, hence the reason why it is very popular. Moreover, it can be collected during any stage of development. Effectiveness can thus be represented as a percentage by using this simple equation:
Although one should always aim for a completion rate of 100%, according to a study carried out by Jeff Sauro, the average Task Completion Rate is 78% (based on an analysis of 1,100 tasks). In the same study, it was also observed that the completion rate is highly dependent on the context of the task being evaluated.
Example: Calculation of effectiveness
Let us take a practical example: 5 users perform a task using the same system. At the end of the test session, 3 users manage to achieve the goal of the task while the other 2 do not. Using the above equation, the overall user effectiveness of the system is worked out as follows:
Number of tasks completed successfully = 3
Total number of tasks undertaken = 5
Inserting the above values into the Effectiveness equation:

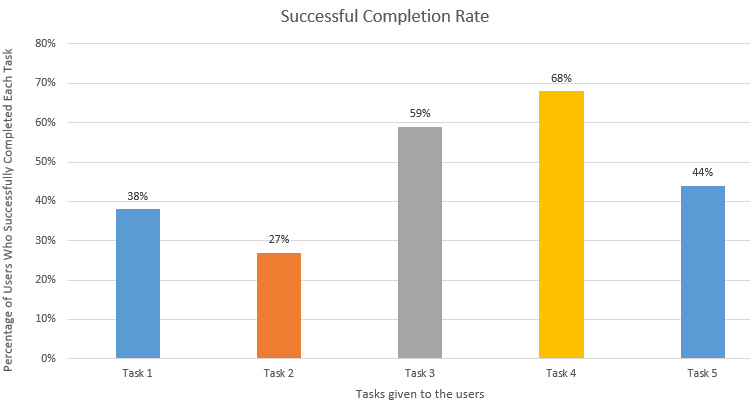
It is also very easy to graphically represent the completion rate, for example as a stacked bar graph as shown in the diagram below (please note that this diagram is not for the example described above)
1.2 – Number of Errors
Another measurement involves counting the number of errors the participant makes when attempting to complete a task. Errors can be unintended actions, slips, mistakes or omissions that a user makes while attempting a task. You should ideally assign a short description, a severity rating and classify each error under the respective category. Although it can be time consuming, counting the number of errors does provide excellent diagnostic information.
Based on an analysis of 719 tasks performed using consumer and business software, Jeff Sauro concluded that the average number of errors per task is 0.7, with 2 out of every 3 users making an error. Only 10% of the observed tasks were performed without any errors, thus leading to the conclusion that it is perfectly normal for users to make errors when performing tasks.
2) Usability Metrics for Efficiency
Efficiency is measured in terms of task time. that is, the time (in seconds and/or minutes) the participant takes to successfully complete a task. The time taken to complete a task can then be calculated by simply subtracting the start time from the end time as shown in the equation below:
Task Time = End Time – Start Time
Efficiency can then be calculated in one of 2 ways:
2.1 – Time-Based Efficiency

Where:
N = The total number of tasks (goals)
R = The number of users
nij = The result of task i by user j; if the user successfully completes the task, then Nij = 1, if not, then Nij = 0
tij = The time spent by user j to complete task i. If the task is not successfully completed, then time is measured till the moment the user quits the task
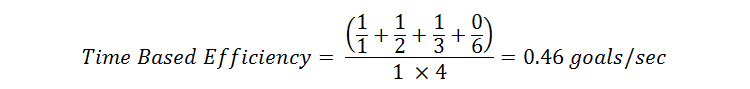
Example: Calculation of time-based efficiency
Once again, let us take a practical example. Suppose there are 4 users who use the same product to attempt to perform the same task (1 task). 3 users manage to successfully complete it – taking 1, 2 and 3 seconds respectively. The fourth user takes 6 seconds and then gives up without completing the task.
Taking the above equation:
N = The total number of tasks = 1
R = The number of users = 4
User 1: Nij = 1 and Tij = 1
User 2: Nij = 1 and Tij = 2
User 3: Nij = 1 and Tij = 3
User 4: Nij = 0 and Tij = 6
Placing the above values in the equation:
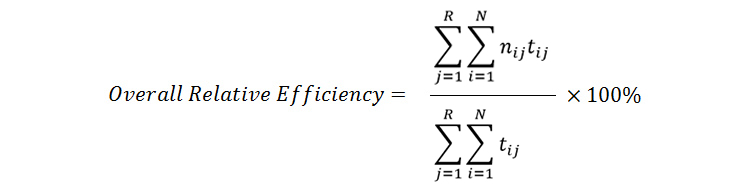
2.2 – Overall Relative Efficiency
The overall relative efficiency uses the ratio of the time taken by the users who successfully completed the task in relation to the total time taken by all users. The equation can thus be represented as follows:
Although it may look intimidating, it is easier to understand if you apply numbers. Let us take the same example as the one cited in section 2.1:
Example: Calculation of overall relative efficiency
Suppose there are 4 users who use the same product to attempt to perform the same task (1 task). 3 users manage to successfully complete it – taking 1, 2 and 3 seconds respectively. The fourth user takes 6 seconds and then gives up without completing the task.
Taking the above equation:
N = The total number of tasks = 1
R = The number of users = 4
User 1: Nij = 1 and Tij = 1
User 2: Nij = 1 and Tij = 2
User 3: Nij = 1 and Tij = 3
User 4: Nij = 0 and Tij = 6
Placing the above values into the equation yields the following:

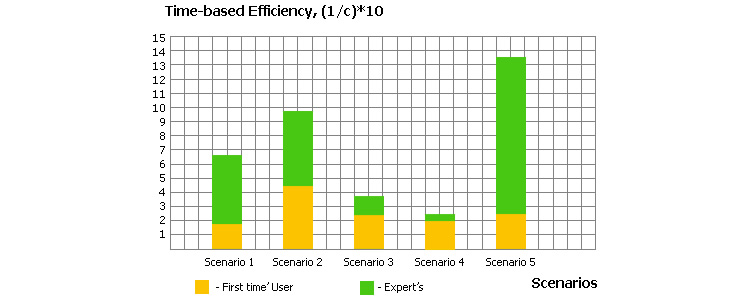
Efficiency can be graphically represented as a bar chart. The example below shows the result of using the time-based efficiency equation for 11 users performing 5 tasks. A stacked bar chart is used to distinguish between the efficiency recorded by first time users as opposed to that for expert users for each task:
3) Usability Metrics for Satisfaction
User satisfaction is measured through standardized satisfaction questionnaires which can be administered after each task and/or after the usability test session.
3.1 – Task Level Satisfaction
After users attempt a task (irrespective of whether they manage to achieve its goal or not), they should immediately be given a questionnaire so as to measure how difficult that task was. Typically consisting of up to 5 questions, these post-task questionnaires often take the form of Likert scale ratings and their goal is to provide insight into task difficulty as seen from the participants’ perspective.
The most popular post-task questionnaires are:
- ASQ: After Scenario Questionnaire (3 questions)
- NASA-TLX: NASA’s task load index is a measure of mental effort (5 questions)
- SMEQ: Subjective Mental Effort Questionnaire (1 question)
- UME: Usability Magnitude Estimation (1 question)
- SEQ: Single Ease Question (1 question)
From the above list, Sauro recommends using the SEQ since it is short and easy to respond to, administer and score.

3.2 – Test Level Satisfaction
Test Level Satisfaction is measured by giving a formalized questionnaire to each test participant at the end of the test session. This serves to measure their impression of the overall ease of use of the system being tested. For this purpose, the following questionnaires can be used (ranked in ascending order by number of questions):
- SUS: System Usability Scale (10 questions)
- SUPR-Q: Standardized User Experience Percentile Rank Questionnaire (13 questions)
- CSUQ: Computer System Usability Questionnaire (19 questions)
- QUIS: Questionnaire For User Interaction Satisfaction (24 questions)
- SUMI: Software Usability Measurement Inventory (50 questions)
The natural question that comes to mind is … “which questionnaire should I use?”
Garcia states the choice depends on the:
Budget allocated for measuring user satisfaction
Importance that the user’s perceived satisfaction has on the overall project
In fact, he recommends that SUMI should be used if there is enough budget allocated and the users’ satisfaction is very important. If the measurement of user satisfaction is important but there is not a large allocated budget, then one should use SUS.
On the other hand, Sauro recommends using SUS to measure the user satisfaction with software, hardware and mobile devices while the SUPR-Q should be used for measuring test level satisfaction of websites. SUS is also favoured because has been found to give very accurate results. Moreover, it consists of a very easy scale that is simple to administer to participants, thus making it ideal for usage with small sample sizes.
Credits: Justin Mifsud